


Parkinson's Disease 101: Polygenic Risk
Learn and donate to a great cause!


Follow along with me: Parkinson’s Disease 101 will be a four-part series!
For the next two months I’ll be writing about Parkinson’s in an effort to raise awareness and money for this devastating neurodegenerative disease. I’ll be walking in this year’s Parkinson’s Foundation Moving Day fundraiser. Please support me by clicking the button below to donate!
The Series So Far
In case you are just joining us, here are the links to the previous posts. They are meant to be read in order, starting with the first one:


The Goal
Last year I published a scientific paper in the journal Brain that investigated Parkinson’s disease. What started out as a “bite sized” project for my postdoctoral fellowship turned into a collaborative and amazing learning experience. I learned so much during this process, and I want to impart some of this knowledge onto you! Scientific papers can be so full of jargon and technical terminology, making them a little intimidating to read. Therefore, my goal is to break down this paper into digestible short posts to take away the most important information.
If you are feeling brave, you can read the original article: link here. Otherwise, let’s start with discussing the role of genetics and Parkinson’s disease.
Polygenic Risk for Parkinson’s Disease
In my previous post, we discussed how a single gene variant, also called a mutation, increased the risk of Parkinson’s disease in individuals that carry one or more copies of LRRK2 G2019S. This mutation is the result of a change in only one letter in the DNA sequence of this gene. This letter change is called a single nucleotide polymorphism, or SNP (pronounced “snip”). Remember this!
Now, this SNP in the LRRK2 gene is just one example of a SNP. What if we expanded this logic to examine all observed SNPs in the LRRK2 gene and their association with the development of Parkinson’s? Would there be any other SNPs in LRRK2 that are strongly associated with Parkinson’s? What about across the chromosome that is home to LRRK2—chromosome 12? What about across all chromosomes?
Depending on the technology used to read SNPs from research participants’ DNA, the number of associations tested could be hundreds of thousands, and even into the millions.1 That’s a lot of associations! When researchers test whether the SNPs across all chromosomes are associated with a specific disease (e.g., Parkinson’s) or trait (e.g., height), it is called a Genome-Wide Association Study—better known by its acronym GWAS.
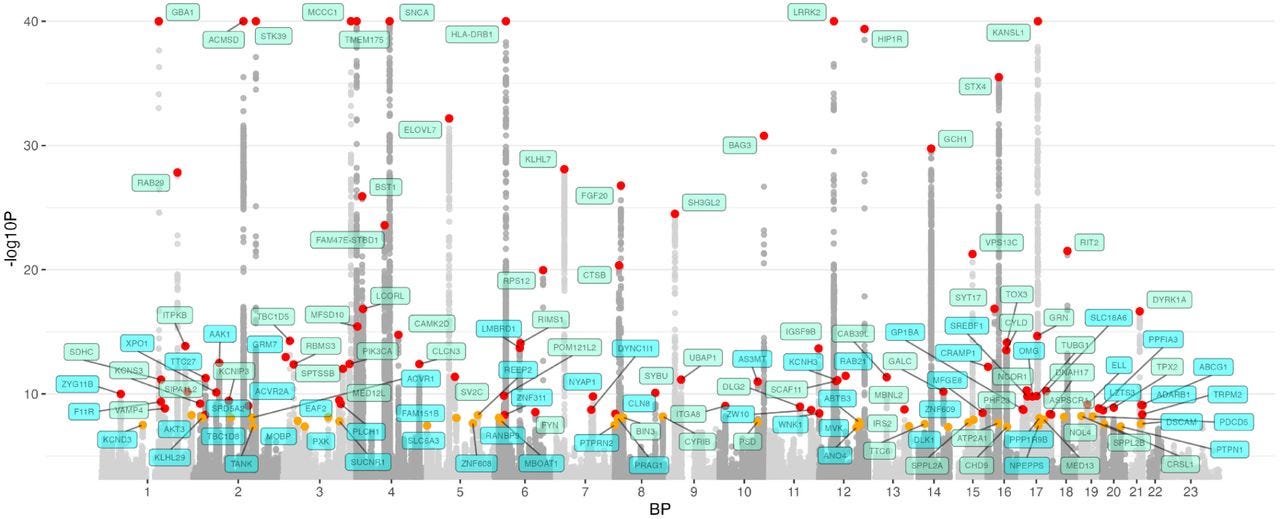
Below is a chart that shows the various associations between SNPs and a diagnosis of Parkinson’s across 23 chromosomes from ~65k research participants of European descent.2 Across the x-axis we see the chromosomes numbered in order from 1–23. Each dot represents a SNP, and its position on the y-axis denotes its strength of association with disease—the higher the dot, the stronger its association with Parkinson’s. For example, if you look at chromosome 12, you will see SNPs from LRRK2 at the top, meaning LRRK2 is strongly associated with Parkinson’s. This type of chart is called a “Manhattan plot” because the clustering of associations closely resembles a skyline, like the Manhattan skyline.
What does this all have to do with “polygenic risk”? Well, a GWAS is how we calculate one’s risk of disease across the genome. In other words, how do your genetics—more specifically, SNPs—across all chromosomes contribute to your risk of a specific disease. This risk is called a polygenic risk or genetic health risk.
Now, let’s consider only the SNPs that have a significant association with Parkinson’s. Each SNP can then be given a weight according to the relationship; a larger weight for stronger relationships (higher on the chart above) while a smaller weight for weaker relationships (lower on the chart above). Calculating a polygenic risk score for an individual then becomes a simple algebra problem that you learned to solve in middle school! For each SNP, take the weight and multiply it by the number of copies you carry of that SNP (0, 1, or 2), add all these products up, and you end up with a score of polygenic risk for a disease!
In my research paper, we used a Parkinson’s PRS to ask the question, “Does the relationship between PRS and Parkinson’s disease differ within LRRK2 G2019S carriers and non-carriers?”
Scroll down to see what we found.
Findings
In our study, we calculated the PRS of LRRK2 G2019S carriers and non-carriers, and divided them into three groups: low PRS, intermediate PRS, and high PRS.3 We then estimated their risk of Parkinson’s relative to non-carriers with intermediate PRS. In other words, all estimates of PD risk are relative to a non-carrier with median PRS.
To explain the results, I’ll refer to this figure below:

On the x-axis, we see odds ratios that quantify the risk of Parkinson’s relative to non-carriers with intermediate PRS. A greater value here indicates greater odds of Parkinson’s (relative to non-carriers with intermediate PRS).
Here are a few key takeaways:
LRRK2 G2019S carriers have greater risk of Parkinson’s than non-carriers. This is evident by examining the general location of the points on the x-axis; LRRK2 G2019S carriers are further to the right, indicating increased relative odds of Parkinson’s.
The risk of Parkinson’s varies within non-carriers. If you examine the points in the blue background, you will see that non-carriers with a high PRS have an odds ratio of 2, meaning that their odds of Parkinson’s is double compared to those with intermediate PRS. Non-carriers with a low PRS had an odds ratio of .63, meaning that their odds of Parkinson’s are nearly 40% lower compared to non-carriers with intermediate PRS. In other words, even if you don’t carry the LRRK2 G2019S variant, your background genetics plays a role in your risk of Parkinson’s.
The risk of Parkinson’s varies even within LRRK2 G2019S carriers. A similar pattern of results are seen in LRRK2 G2019S carriers. A high PRS in carriers conveyed a 16-fold greater odds of Parkinson’s relative to non-carriers with intermediate PRS. This reduced down to a 6-fold greater relative odds of LRRK2 G2019S carriers with low PRS. In other words, the background genetics of LRRK2 G2019S carriers also plays a role in the risk of Parkinson’s.
Why do these results matter? Although we cannot predict who will develop Parkinson’s disease, we can improve our estimates of risk by additionally examining genetics. We know that LRRK2 G2019S carriers are at higher risk for Parkinson’s, but by additionally examining background genetics, which are quantified by PRS, we can further refine estimates of risk. With better estimates of risk come better selection criteria for clinical trials. Enriching clinical trial cohorts with participants more likely to develop Parkinson’s will improve the testing of drugs and interventions aimed to modify Parkinson’s disease progression.
Summary
By testing hundreds of thousands of associations between SNPs and disease outcomes, called a GWAS, we can build algorithms for calculating polygenic risk. Polygenic risk of Parkinson’s varied among carriers of LRRK2 G2019S and non-carriers. Polygenic risk may help enrich cohorts of clinical trials to better test disease modifying therapies for Parkinson’s.
For the next two months I’ll be writing about Parkinson’s in an effort to raise awareness and money for this devastating neurodegenerative disease.
I’ll be walking in this year’s Parkinson’s Foundation Moving Day fundraiser. Please support me by clicking the button below to donate!
Uffelmann, E., Huang, Q.Q., Munung, N.S. et al. Genome-wide association studies. Nat Rev Methods Primers 1, 59 (2021). https://doi.org/10.1038/s43586-021-00056-9
The Global Parkinson’s Genetics Program (GP2) & Leonard, H. L. (2025). Novel Parkinson’s Disease Genetic Risk Factors Within and Across European Populations. medRxiv. https://doi.org/10.1101/2025.03.14.24319455
In order to fairly compare LRRK2 G2019S carriers to non-carriers, we modified the PRS slightly by removing the SNPs surrounding the LRRK2 gene. This allowed us to more fairly examine the background genetics of LRRK2 G2019S carriers and non-carriers.