
Named vectors in R
A powerful tool for plotting colors

I recently asked ChatGPT to help me do something in R, and the output shocked me. It shocked me not because ChatGPT’s solution was brilliant or super complex, but because it taught me something so basic in R: naming a vector in one line.
What struck me the most was how I was able to learn and use R across the better part of a decade without knowing this basic functionality of the concatenate function, i.e., c().
Like most programmers out there, I’m largely self-taught. A few of my graduate courses incorporated R into their curriculum; however, R was never the focus and I didn’t get to experience an R course that started with the basics and progressed into more advanced concepts.
My knowledge of R, therefore, is a hodgepodge of concepts that continues to grow to this day. And with the recent invention of large language models, such as ChatGPT, I’ve been having lots of fun interrogating the models for solutions to programming issues, or having it do things that I’m too lazy to do.
I’m almost embarrassed to reveal my ignorance here, but the cool R tricks I am learning from ChatGPT are too useful to not document. Now, let’s get on with this base R functionality.
The usual way I would create a vector and name it was in two steps:
vec <- c(1:3)                                 # step 1
names(vec) <- c("group1", "group2", "group3") # step 2
print(vec)

group1 group2 group3
     1      2      3
However, ChatGPT’s solution was:
vec <- c("group1" = 1, "group2" = 2, "group2" = 3) # one step!
print(vec)

group1 group2 group3
     1      2      3
I had no idea that you could name elements of vectors straight in the concatenate function c(). This is such a basic functionality in R and is likely taught on day 1. The fact that I learned it on day 3,650 baffles me, but also is a great reminder that ChatGPT and other LLMs are amazing learning tools.
Why I love named vectors
There are so many use cases for the named vector in R, but I will just cover my favorite: setting colors for ggplots.
One of my favorite aspects of data visualization is picking out a visually striking color palette that suits the data (if the plot requires color). I love testing out new palettes and experimenting with different colors. But I always found it tedious and unpredictable which colors would show up assigned to different groups when using the ggplot2 package.
Here’s an example:
data(iris)
library(ggplot2)
cols <- palette.colors()
p <-
  ggplot(iris, aes(Sepal.Length, Sepal.Width, color = Species)) +
  geom_point() +
  theme_bw()
p + scale_color_manual(values = c(cols[9], cols[2], cols[3]))
But this issue is inelegant because setting the colors within scale_color_manual() creates issues when you want to change the colors across several plots simultaneously, and also will not hold up if you decide to remove a group.
For example, look what happens if we drop the versicolor group:
library(dplyr)
ggplot(
  iris %>% filter(!Species %in% "versicolor"),
  aes(Sepal.Length, Sepal.Width, color = Species)
  ) +
  geom_point() +
  scale_color_manual(values = c(cols[9], cols[2], cols[3])) +
  theme_bw()
But this is not ideal as we intended virginica to be blue not yellow! This is because scale_color_manual() goes by alphabetical or factor level order.
I’ve found that the named vector is a great solution to these issues. Here’s how I would define my named vector in just one line!
tc <- c(setosa = cols[9], versicolor = cols[2], virginica = cols[3])
print(tc)

    setosa versicolor  virginica
 "#999999"  "#E69F00"  "#56B4E9"
And to use this named vector flexibly in plots:
> p + scale_color_manual(values = tc)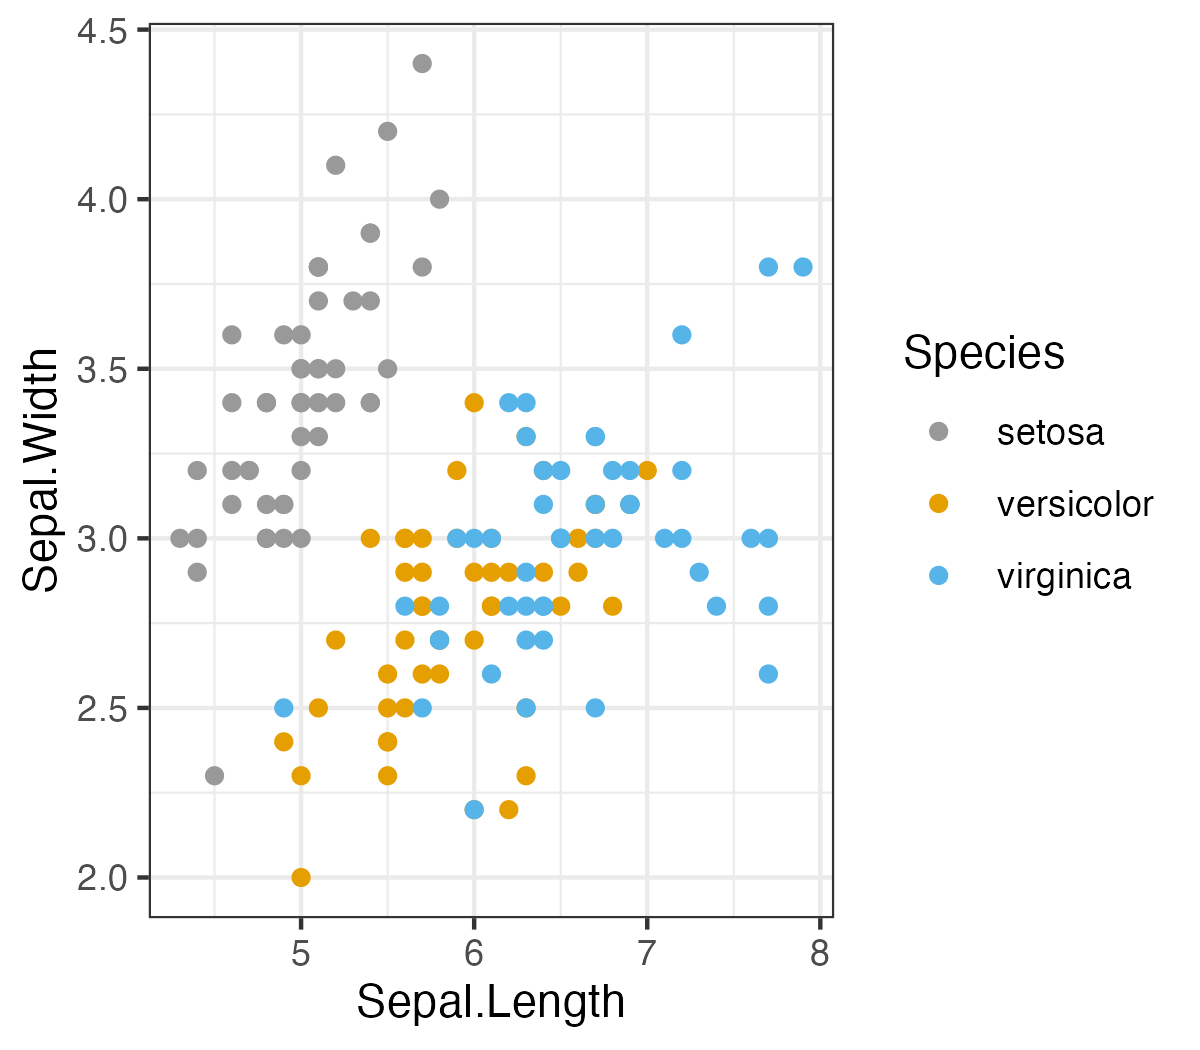
Now, let’s see what happens if we decide to filter out the versicolor group from our plot:
ggplot(
  iris %>% filter(!Species %in% "versicolor"),
  aes(Sepal.Length, Sepal.Width, color = Species)
  ) +
  geom_point() +
  scale_color_manual(values = tc) +
  theme_bw()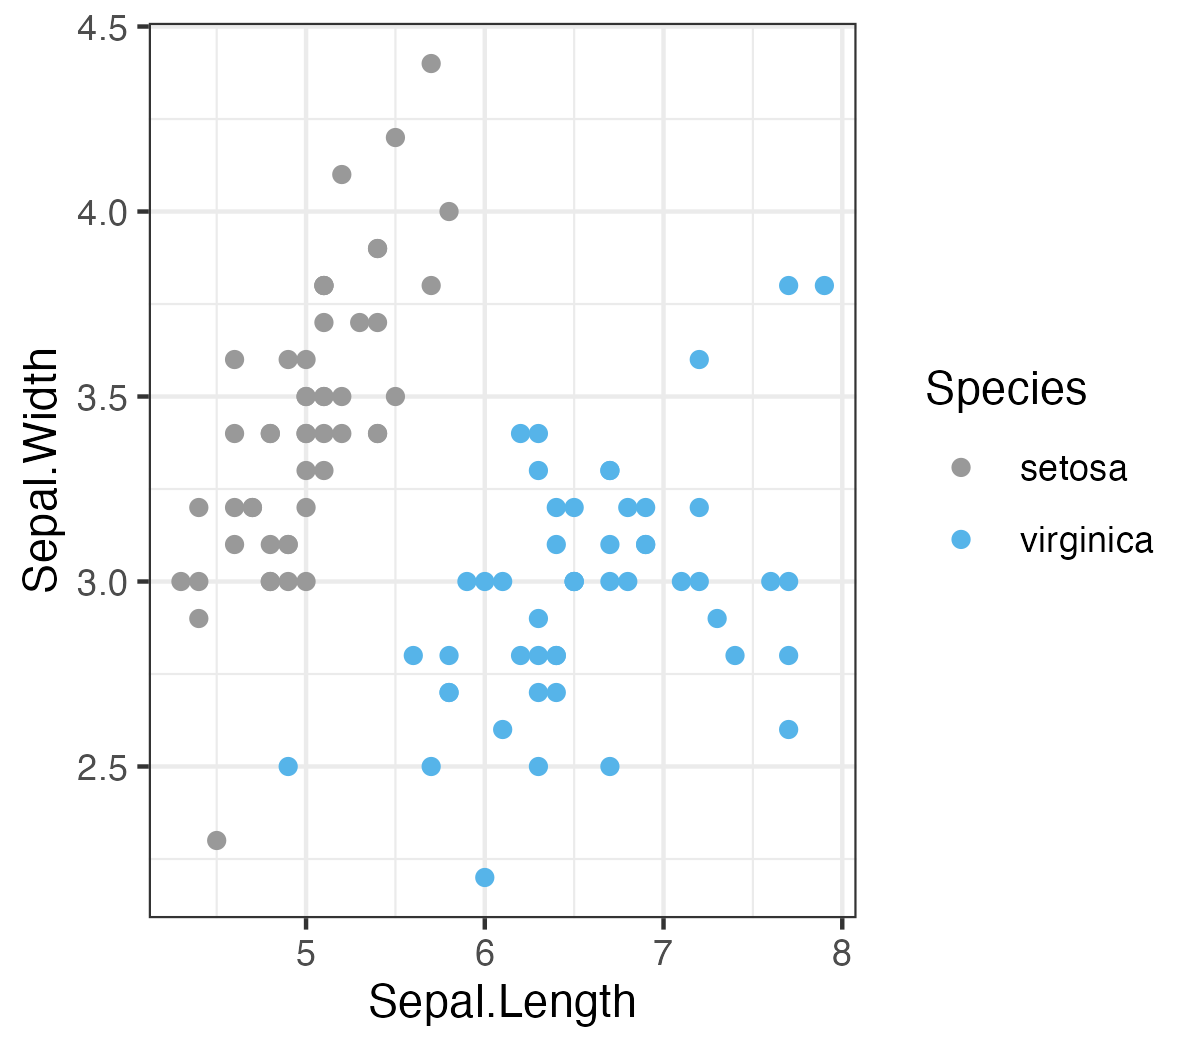
As you can see, the group is removed and the color palette remains the same thanks to the named vector.
Therefore, a named vector ensures explicit and flexible assignment of color.
Another way of creating a named vector is using setNames():
tc <- setNames(cols[c(9, 2, 3)], c("setosa", "versicolor", "virginica"))
print(tc)

setosa versicolor  virginica
 "#999999"  "#E69F00"  "#56B4E9"
Summary
ChatGPT continues to teach me new things about R, even if those “new things” are supposed to be abilities I should have learned early on in my R journey. I love named vectors, and especially like using them to define colors in my plots among other things (e.g., line type, shape, etc.).